
Sport News
Football Predictions in 2027: How Fans Can Analyze Team Form Before Major Matches
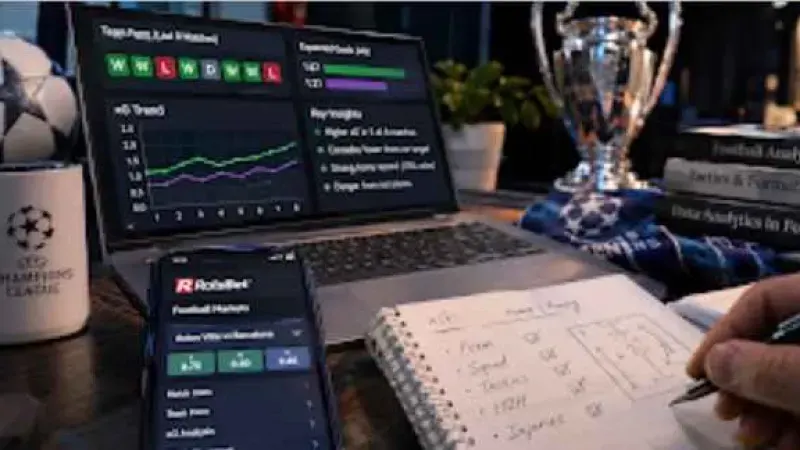
Football analytics in the age of gigabit speeds has ruthlessly killed off the cosy old-school pundit gatherings with their categorical arguments along the lines of “the ball is round, the pitch is green”. A fan’s notoriously unreliable gut feeling and a club’s last five results can lie almost as convincingly as the league table after the second round. A team can win three in a row while creating one chance per night, or lose twice after twenty shots and a couple of efforts off the woodwork. That is why, in 2027, it makes more sense to read form through what actually happened in matches and the context around them. A row of green icons is far too crude for that.
Gathering squad information, dissecting coaches’ plans and taking the psychological temperature of the dressing room have become compulsory rituals before kick-off. Fans spend hours studying heat maps, pressing-intensity charts and movements in the odds, filtering out the surrounding informational noise. The RolsBet official site helps provide a reliable reference point in this raging ocean of numbers, trends and expert opinions by bringing together carefully compiled sporting statistics for the biggest football clashes.
Recent matches need to be analysed, not counted
Beginners often think otherwise, but a winning streak by itself tells you very little. What matters more is understanding how the team collected those points. The official Premier League now publishes xG alongside conventional statistics. By the end of October, Erling Haaland had scored nine goals from 6.08 xG, while Alexander Isak had six from 4.27. The gap between actual goals and the quality of the chances helps identify a hot finishing streak that would be dangerous to project automatically into the following month.
For the last five to eight matches, it is useful to build a short profile:
- xG and xG conceded show the quality of chances created and allowed;
- shots on target separate sterile possession from genuine pressure;
- goals from set pieces matter ahead of cup ties;
- the scoreline at eleven versus eleven is more informative than a match that spent half an hour distorted by a red card.
It is better to compare figures within the same source. Different xG models assess the same shot slightly differently, so mixing datasets can easily produce a picture that looks persuasive but is fundamentally crooked.
There are plenty of practical examples. In October 2026, for instance, Manchester United were being savaged for sitting 16th in the Premier League, even though the quality of their chances consistently placed them among the division’s top eight and they were mainly suffering from an abnormal finishing deficit. Manchester City’s 5–3 victory over Sunderland in Matchweek 5 on 20 September 2026, meanwhile, concealed enormous defensive problems. By the quality of chances conceded, City somehow managed to lose that game, allowing their opponents to generate a record 4.25 xG.
Home, away and style change the meaning of the data
Overall statistics can easily hide a club that suffocates opponents with a high press at home, then drops deeper away and creates far less. Head-to-head history needs filtering as well. A match from three years ago involving another coach and half a new squad has a value somewhere around zero.
Take some recent examples. In the 2026/27 Champions League, Barcelona lead the possession statistics with 62%, followed by Manchester City on 58.2%, while Como have recorded 91% passing accuracy. These figures illustrate different playing styles but cannot predict match results on their own. Those numbers describe team habits and possible tendencies, but on their own they do not predict the score.
Before analysing a specific pairing, it is worth checking the things that will shape the balance of power on the pitch itself:
- how the team plays through a high press;
- who covers the space behind the full-backs;
- how dangerous the opposition is immediately after regaining possession;
- who holds the aerial advantage at set pieces.
UEFA regularly dissects pressing and attacking structures in its technical reports. Its analysis group explained the 2025 Champions League final through PSG’s aggressive pressure and the constant movement of their forward line. Comparing those trends yourself and putting your football insights to the test is easiest on a reliable platform. For quick access to detailed markets and in-depth analysis, we recommend completing the RolsBet login, allowing you to assess each side’s chances for yourself before every round.
Relative metrics instead of absolute ones
Professional analysts are increasingly moving away from absolute numbers in favour of relative measures. Comparing a team’s shots with those of its opponent in the same match gives a clearer picture than isolated statistics. A study covering six European leagues found that differential metrics — shots for minus shots against — predicted victory more accurately than raw totals. It makes sense. If Real Madrid fire fifteen attempts at the goalkeeper while their opponent manages fourteen, that is not dominance but a contest. Fifteen against three is another matter.
Check the squad twice
A prediction made in the morning can be stale by the evening. An injury during the warm-up, a suspension, rotation after a demanding away trip or an unexpected formation change can alter a match more than many historical trends.
In the 2026/27 Champions League, the official team sheet must be submitted at least 75 minutes before kick-off. UEFA also updates changes to competition squads throughout the season.
Before making a final assessment, it is worth checking three more things:
- The starting eleven and the bench.
- Absences specifically in the areas through which the team builds its game.
- Substitution options if the scenario changes after half-time.
One missing reserve defender and one absent first-choice striker technically produce the same number in an injury list. For the match itself, however, the consequences are completely different.
What to do with all this information
Analysing form in 2027 requires discipline. The data are available, but interpretation still belongs to the fan. Start with relative metrics, then move on to xG and xPTS. Physical data should be used as context rather than the main argument. Finally, playing style, venue and the history of the matchup help establish how comfortable the pairing really is for a particular team.
The main trap is overvaluing a single metric. xG without context can mislead, distance covered is useless without accounting for the opponent, and style without the players to execute it becomes an abstraction. A fan who can hold several layers of information in mind at once has an advantage over someone looking only at the table or exclusively at the odds.